Stock Investing Copilot · iPhone + web

Every
move
has a
story.

A chart engine that names the shape, computes the levels and lets you replay any day — plus why each stock moved, in plain words.

Plans from $20/mo

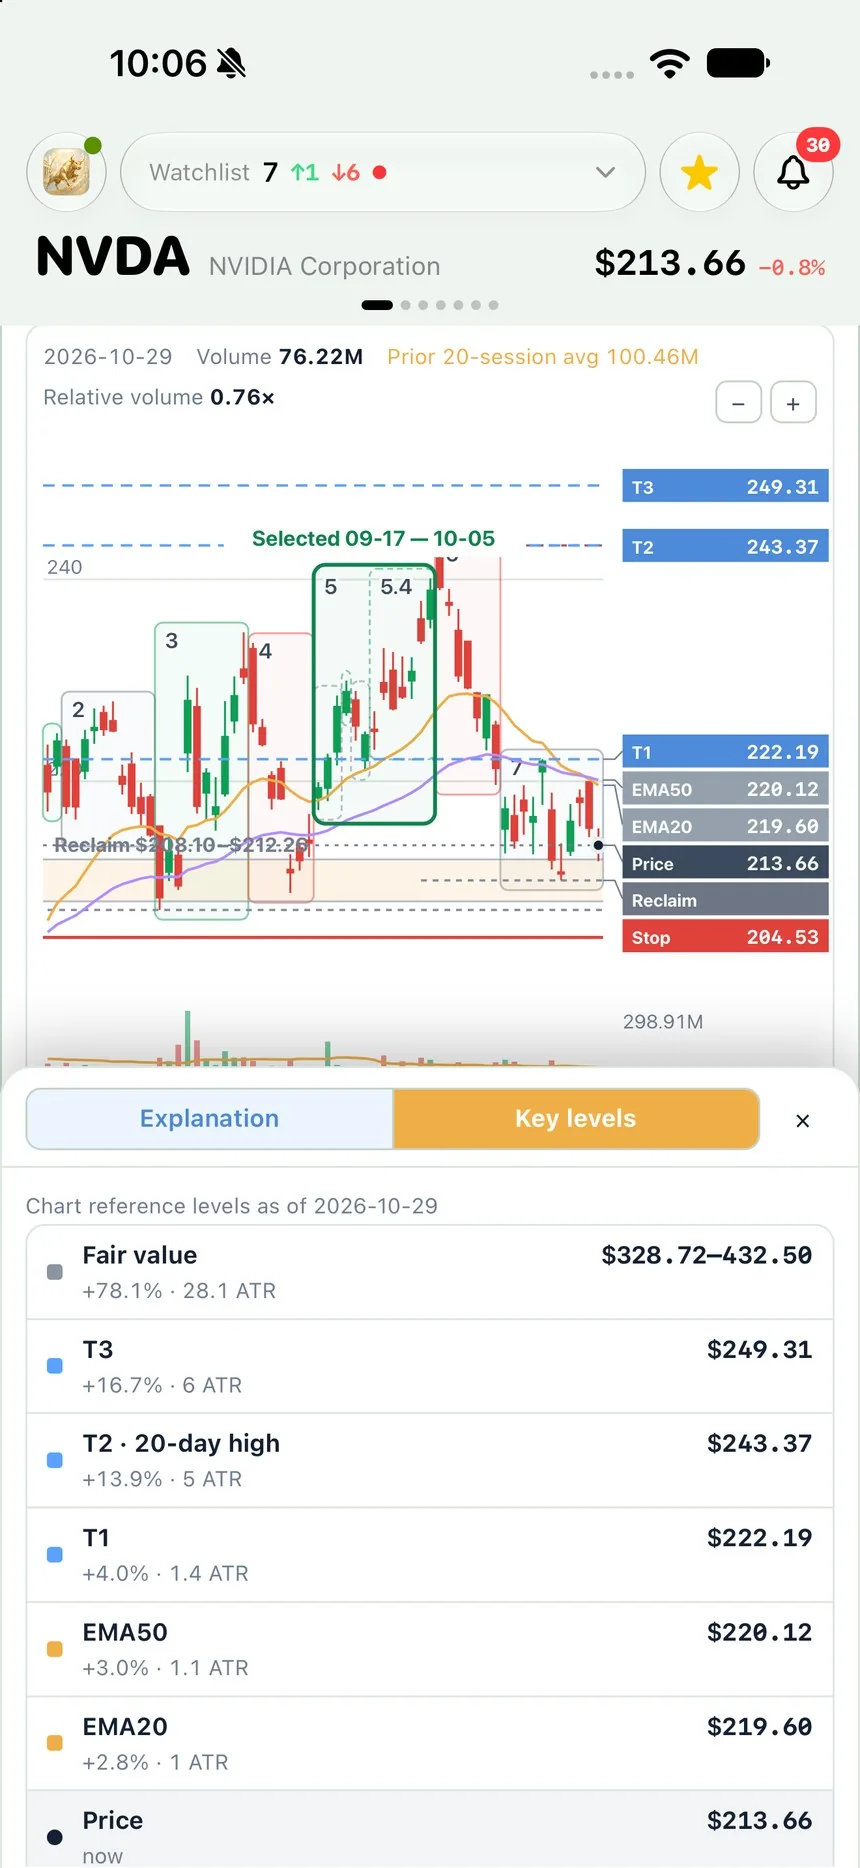
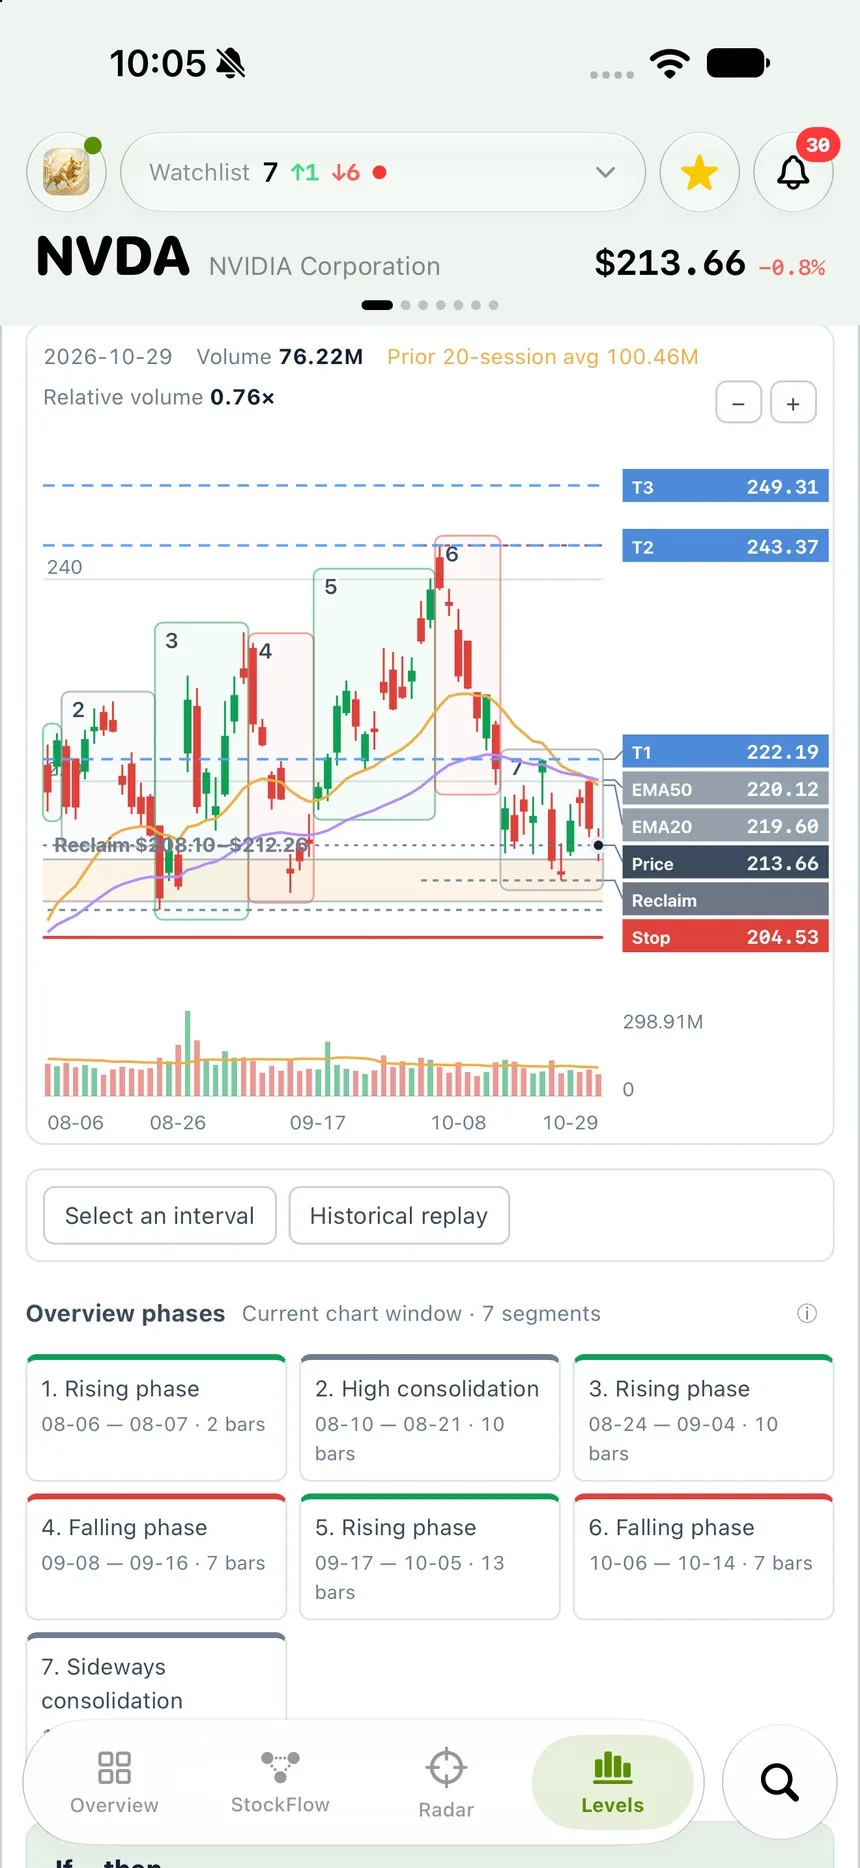
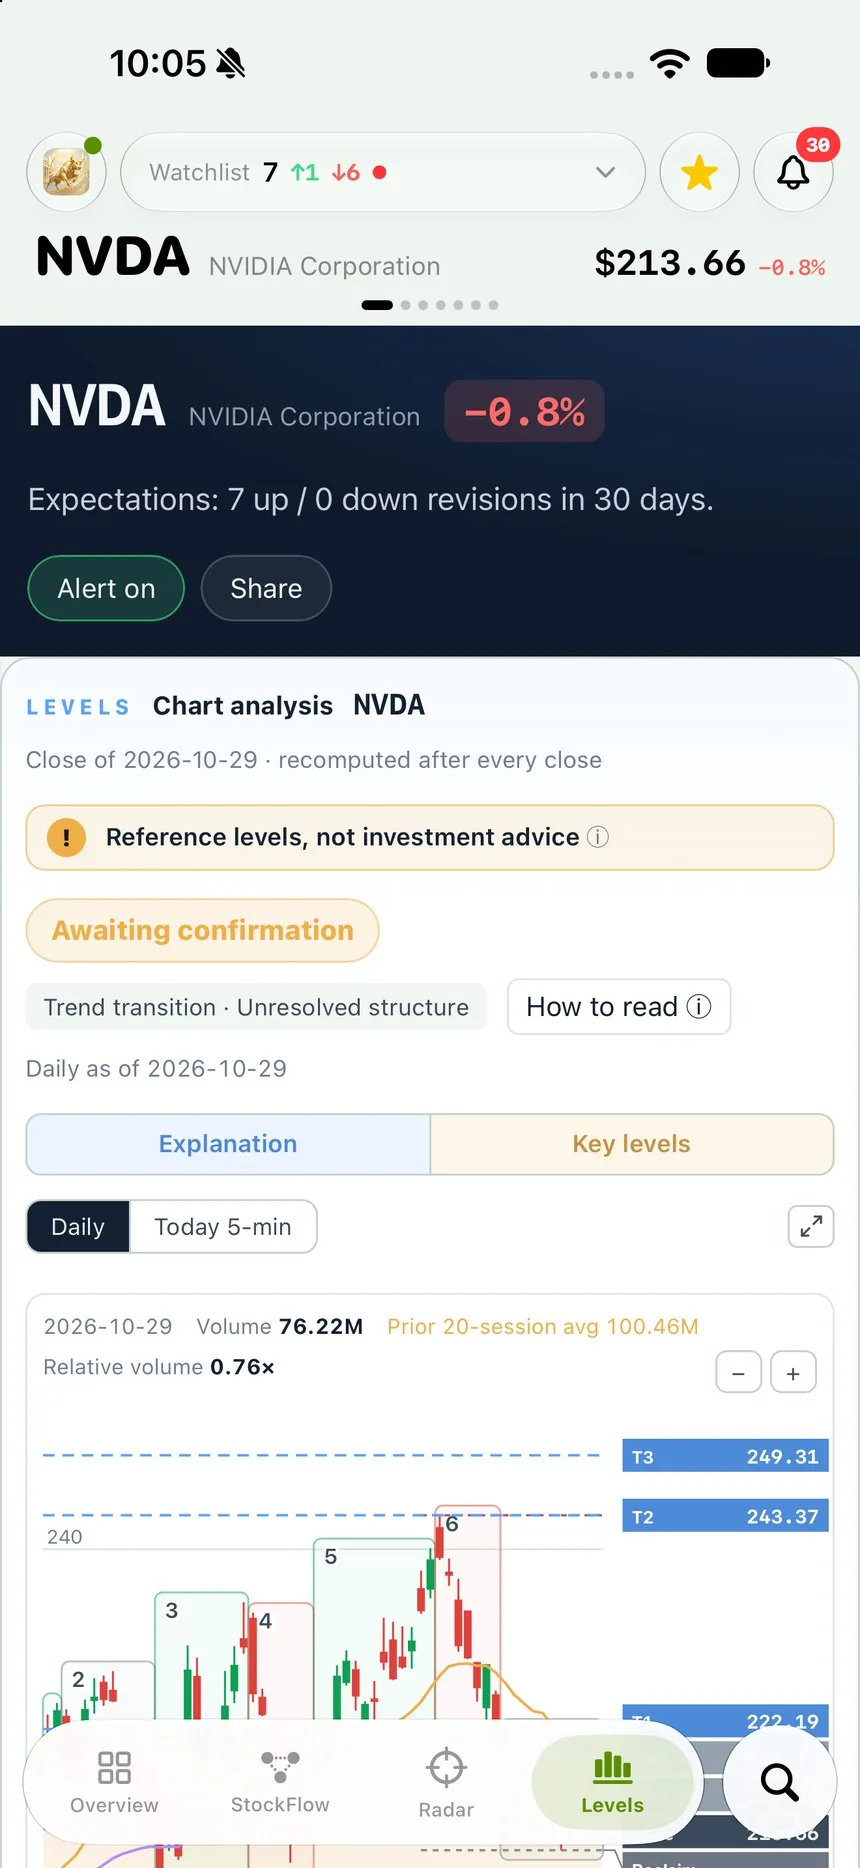
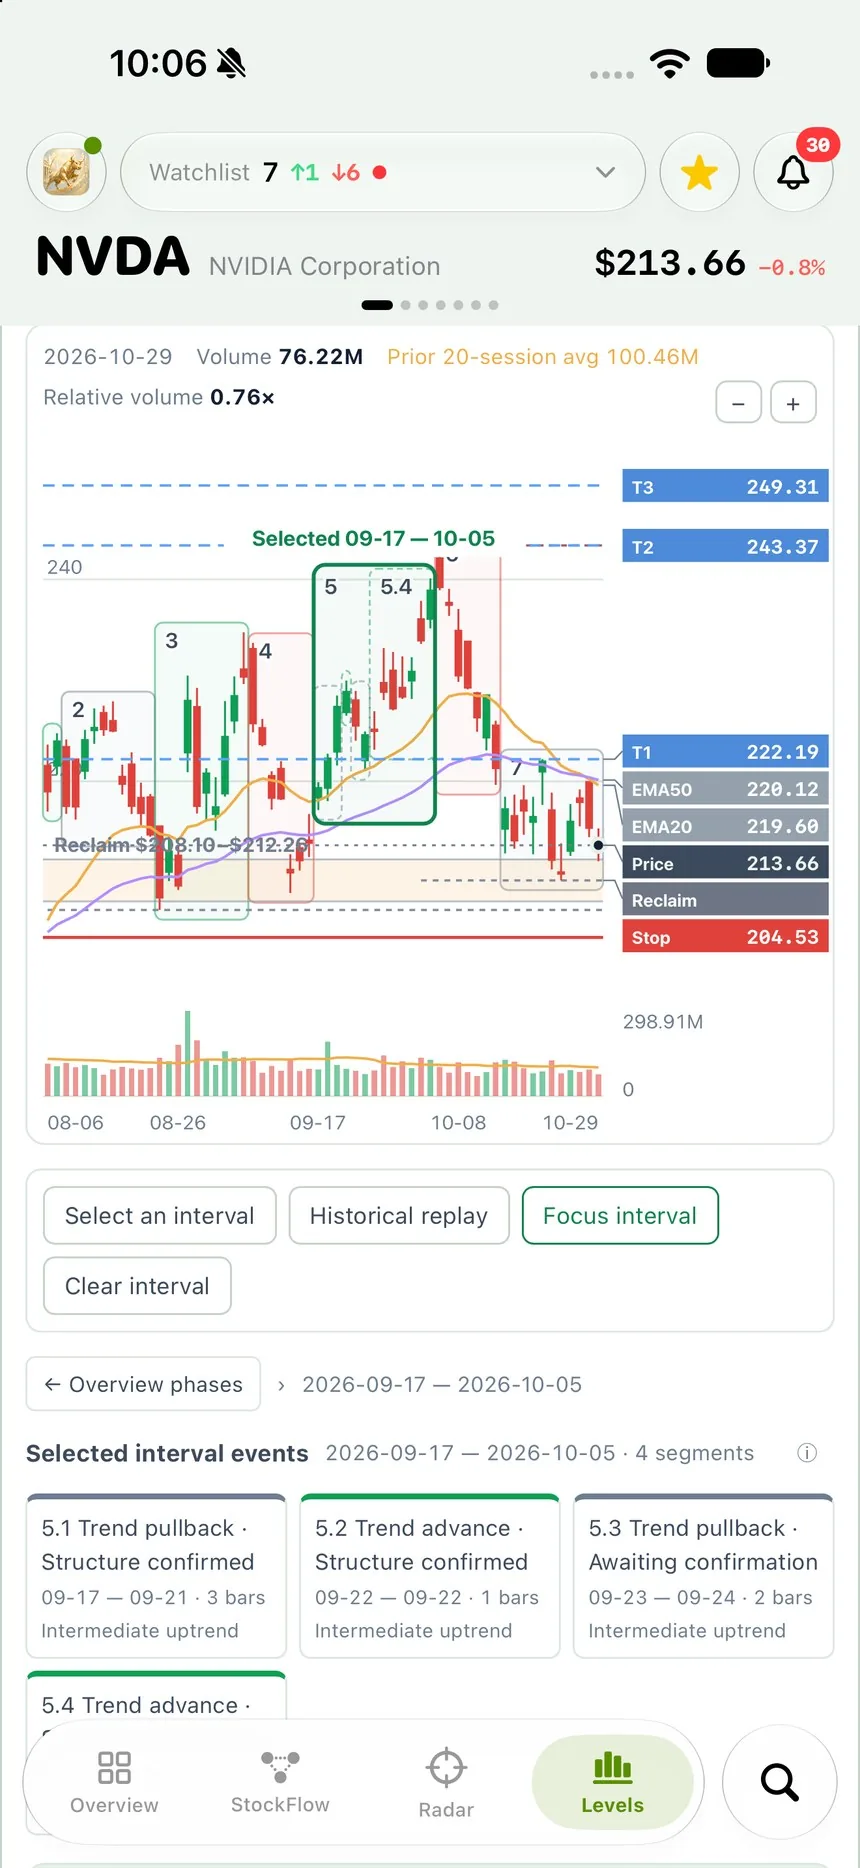
Chart analysis in the iPhone app: NVDA's daily chart boxed into numbered phases, with T1 to T3, the averages, a reclaim zone and a stop, and the list of phases below

① The boxes

Shape, detected

Each phase is found as it forms: a move must beat 1.25 ATR, a base needs 8 tight sessions, a change needs 3 confirmations. No future bars.

② The column

Levels, computed

T1–T3 are the next overhead resistances; the stop sits under the structure. Recalculated after every close.

③ The buttons

Select. Replay.

Box any stretch for its own read, or go back to any day and see what the chart said then — with only that day’s data.

④ The list

Every phase, named

Rising, falling, high or low base, sideways — dated and counted in bars. Tap one to read it.

Real app screenshot · NVDA chart analysis, close of 2026-10-29

Four tabs.
Four questions.

Every stock in the app opens on the same four tabs at the bottom of the screen. Read them left to right.

Tab 1 · Overview

Why did it move?

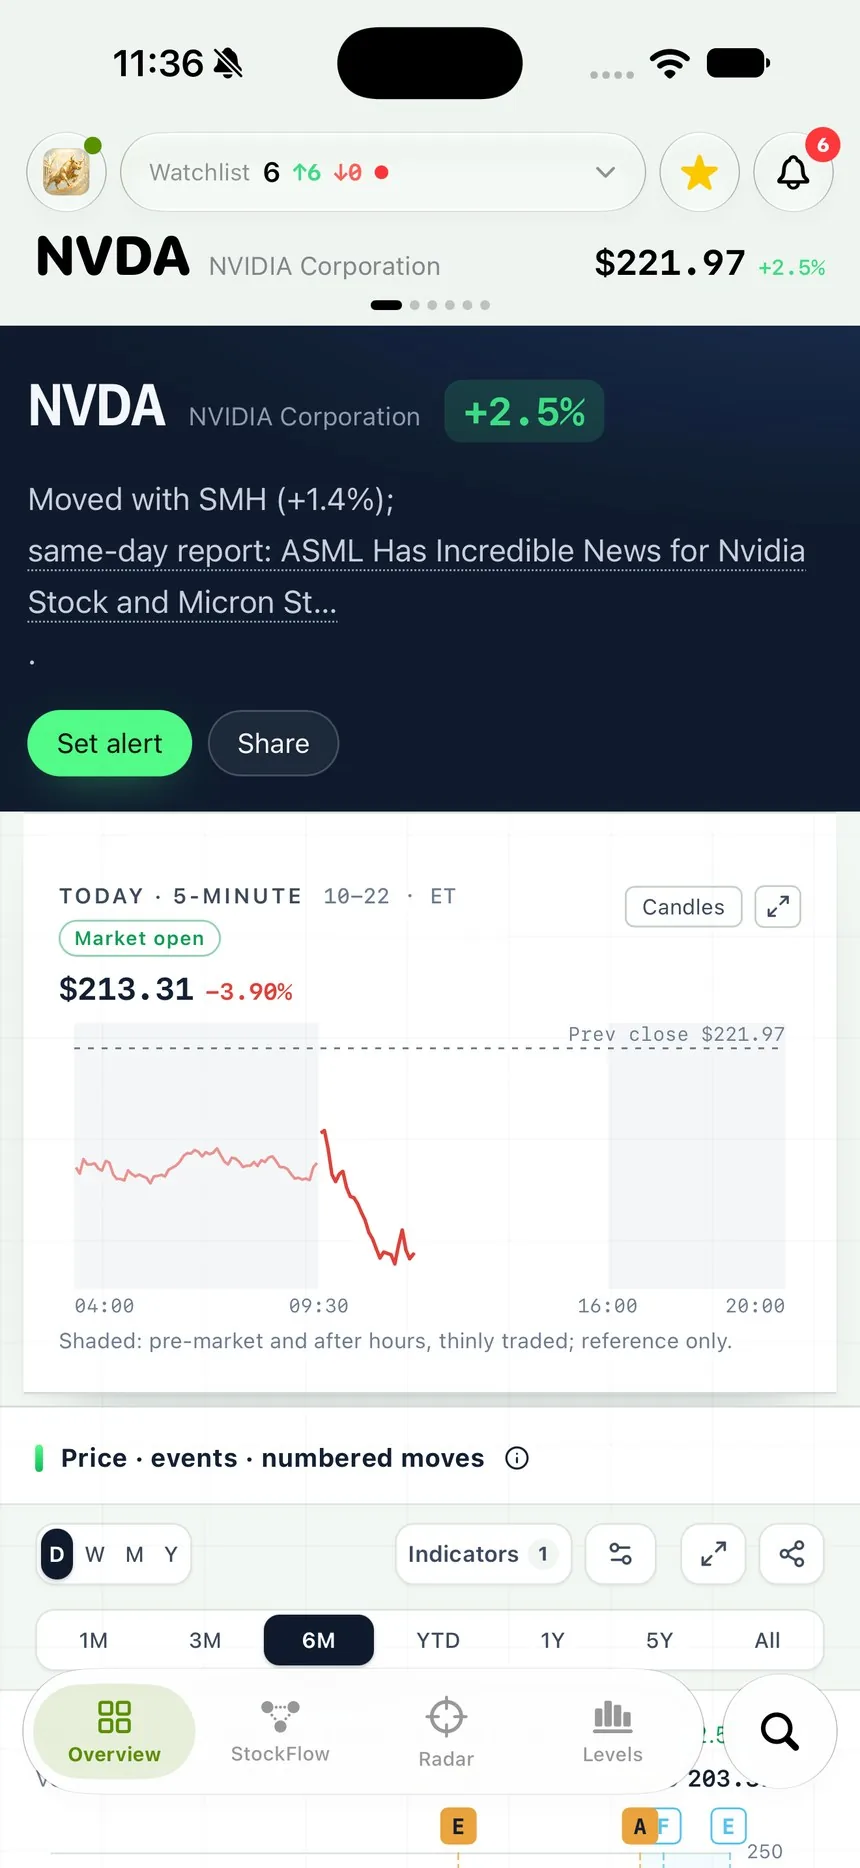
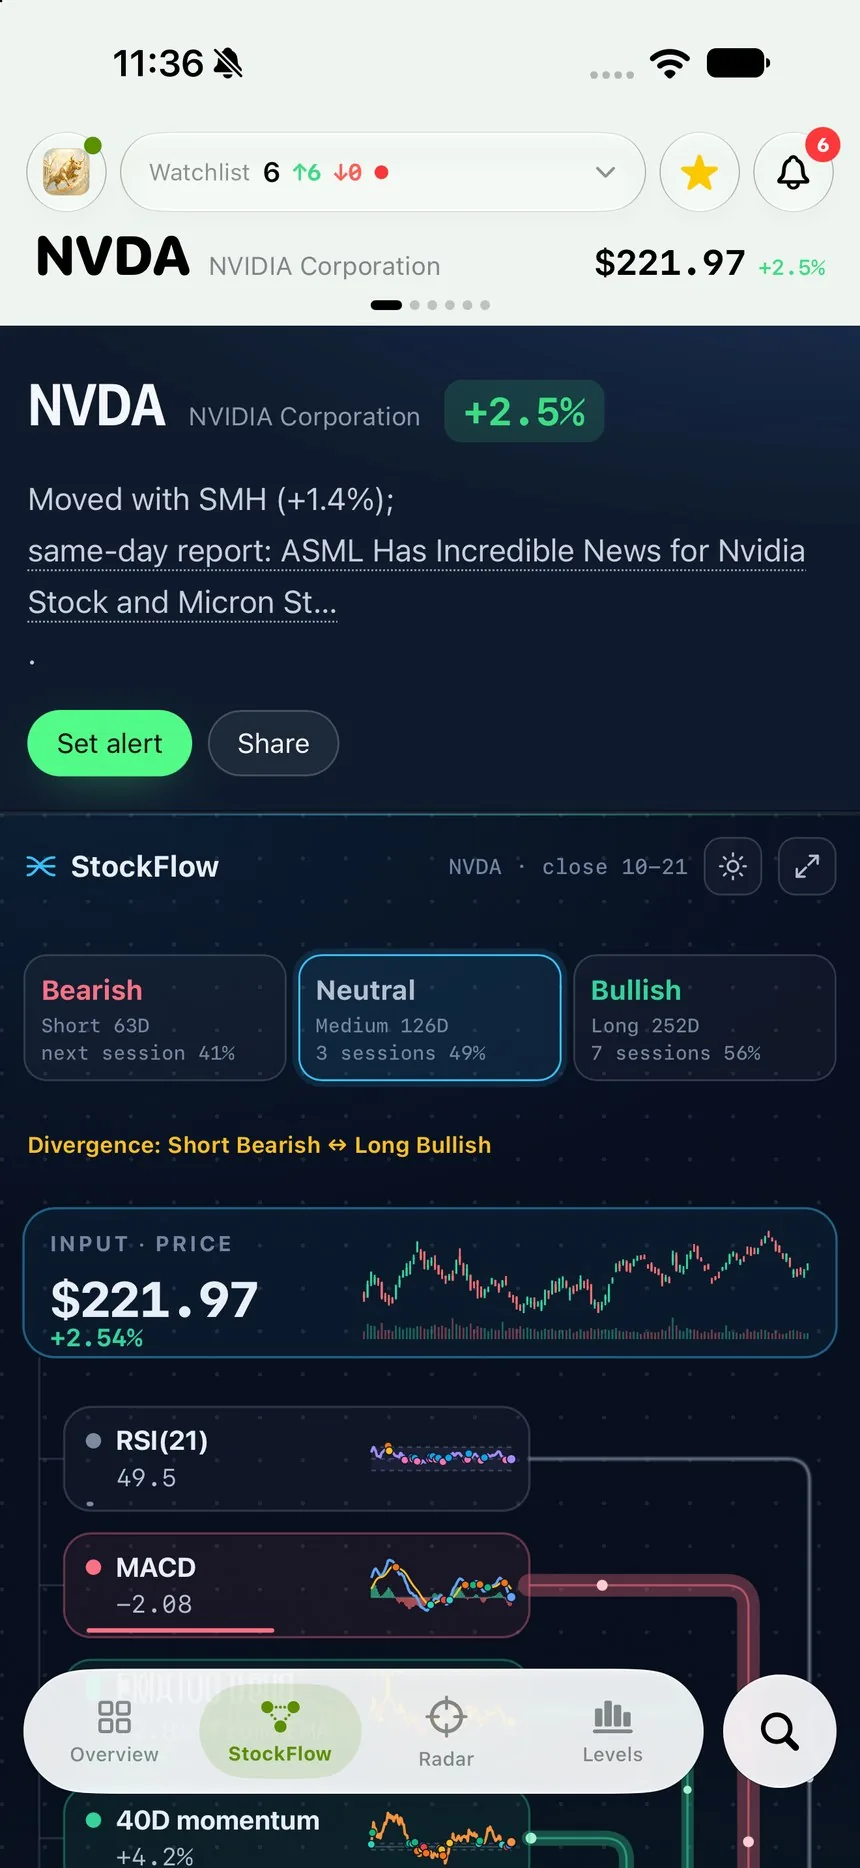
Overview tab: +2.5%, moved with SMH, and today's 5-minute chart

1 · The move and its reason: “+2.5% — moved with SMH (+1.4%),” plus the same-day report.

2 · Today in 5-minute steps, against yesterday’s close.

Free · 5 stocks a day

Tab 2 · StockFlow

Is the trend with it?

StockFlow tab: bearish short term, neutral medium term, bullish long term, and the factors

1 · One word per period: short bearish, medium neutral, long bullish — and a note when they disagree.

2 · The inputs behind it: RSI, MACD, trend, momentum, volume.

Free view-only · full on Plus

Tab 3 · Radar

Is the company worth it?

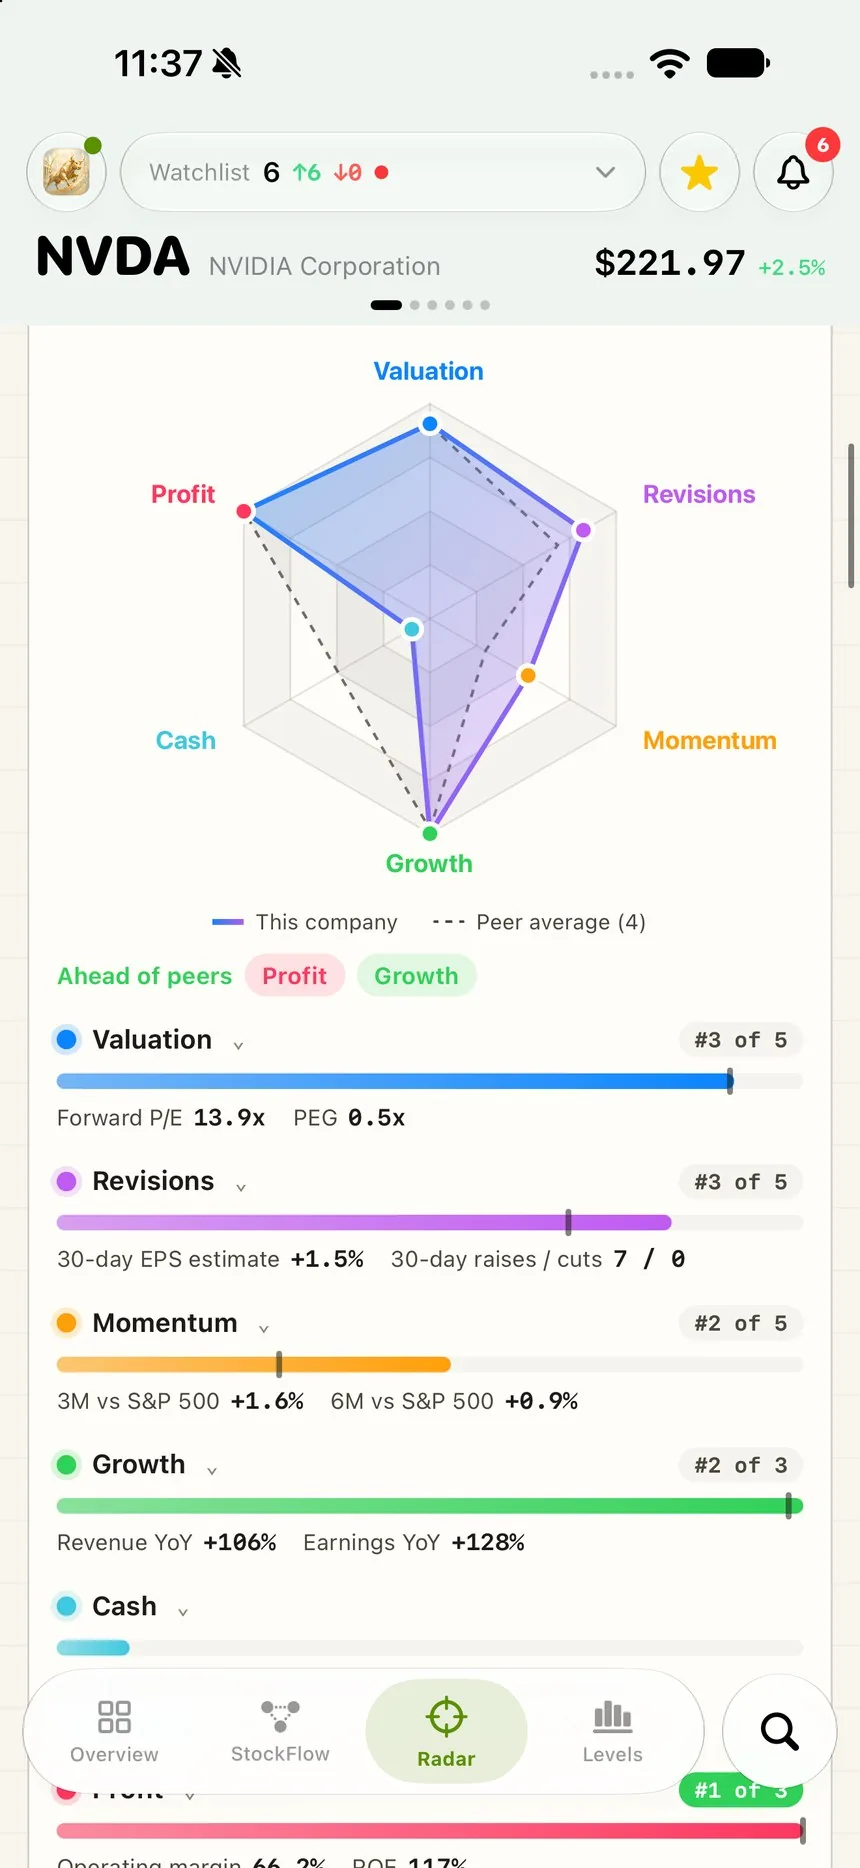
Radar tab: six-axis company profile against four peers, with ranks

1 · Six axes against its peers: valuation, revisions, momentum, growth, cash, profit.

2 · Each one ranked: “Valuation #3 of 5 — forward P/E 13.9×, PEG 0.5×.”

Free account · full dossier on Premium

Tab 4 · Levels

Where would I act?

Chart analysis: the daily chart in numbered phases with targets and a stop, and the list of phases

1 · Phases detected from the price itself, and levels computed from the structure — both redone after every close.

2 · Every phase named and dated, ready to tap: “5. Rising phase · 09-17 — 10-05 · 13 bars.”

Elite · See it step by step ↓

New · Chart analysis · Elite

Read the chart
before you act.

No indicators to set up and no lines to draw. Open the Levels tab and scroll — six screens, from the shape of the chart to the size of your position.

The current read: awaiting confirmation, trend transition, unresolved structure
01

A verdict, with a status

The engine reads trend, pattern and confirmation separately — from average slopes, higher or lower swings, and where price closes against the 50-day. Fourteen patterns, each forming, confirmed or failed. Today NVDA: “Awaiting confirmation · trend transition.”
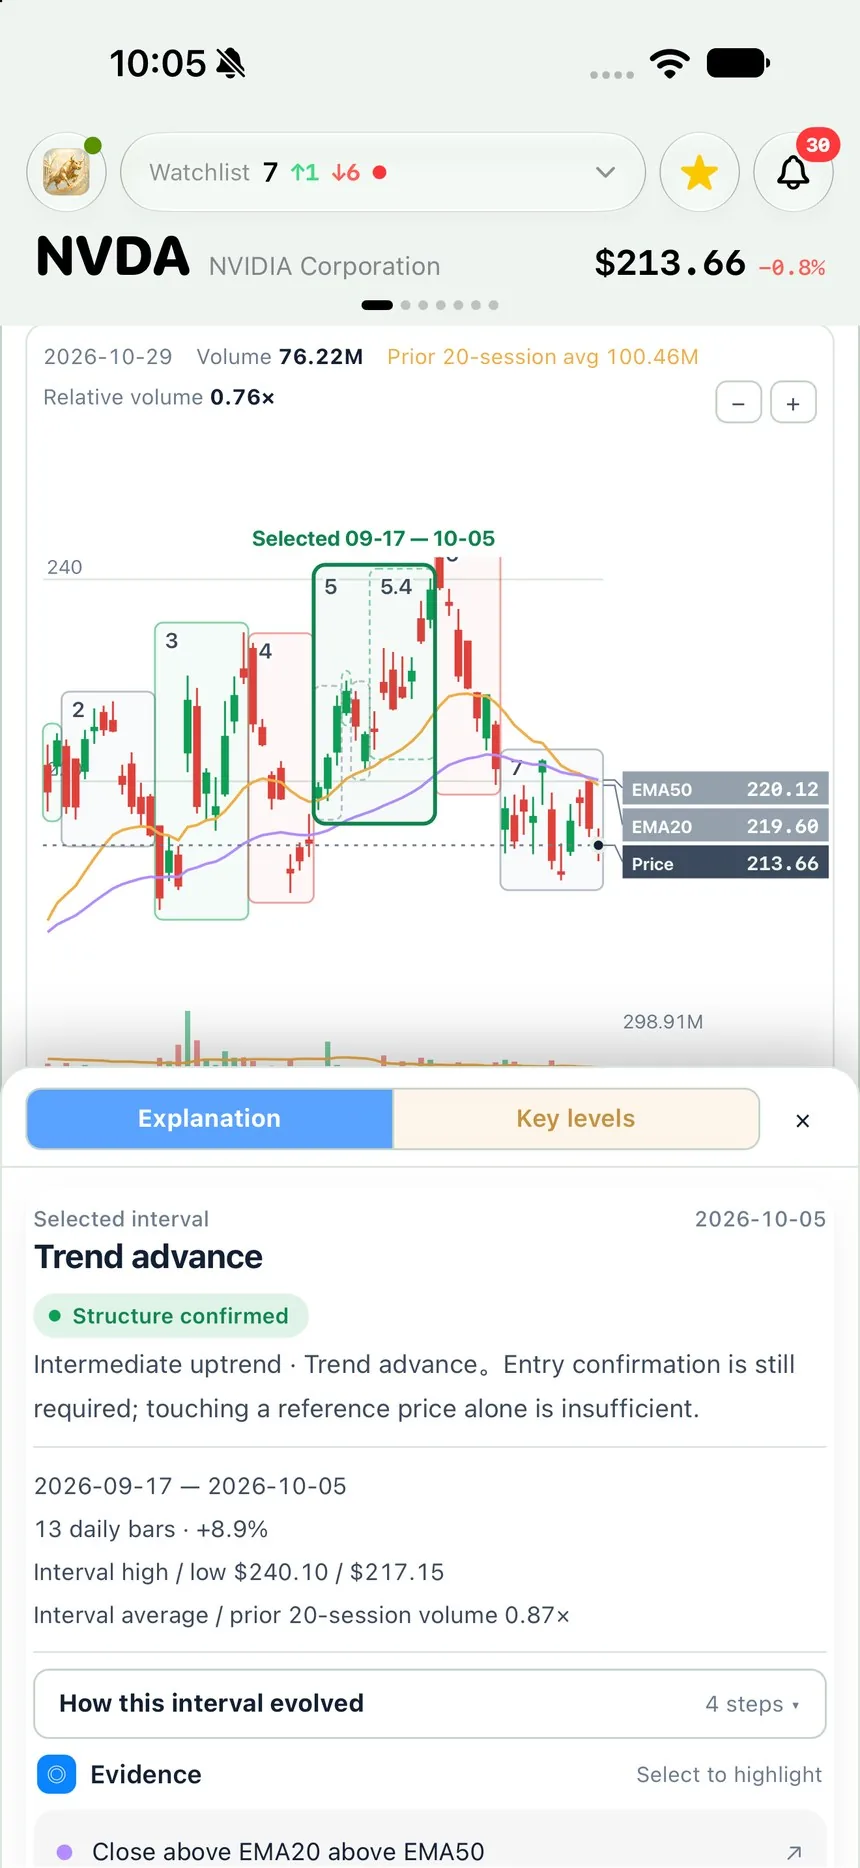
A selected interval: trend advance, structure confirmed, 13 daily bars, +8.9%
02

Box any stretch

Tap a phase or drag your own dates and get its read: “Trend advance — structure confirmed. 13 daily bars, +8.9%,” its high and low, volume against the prior 20 sessions, and the evidence — tap one to highlight it on the chart.

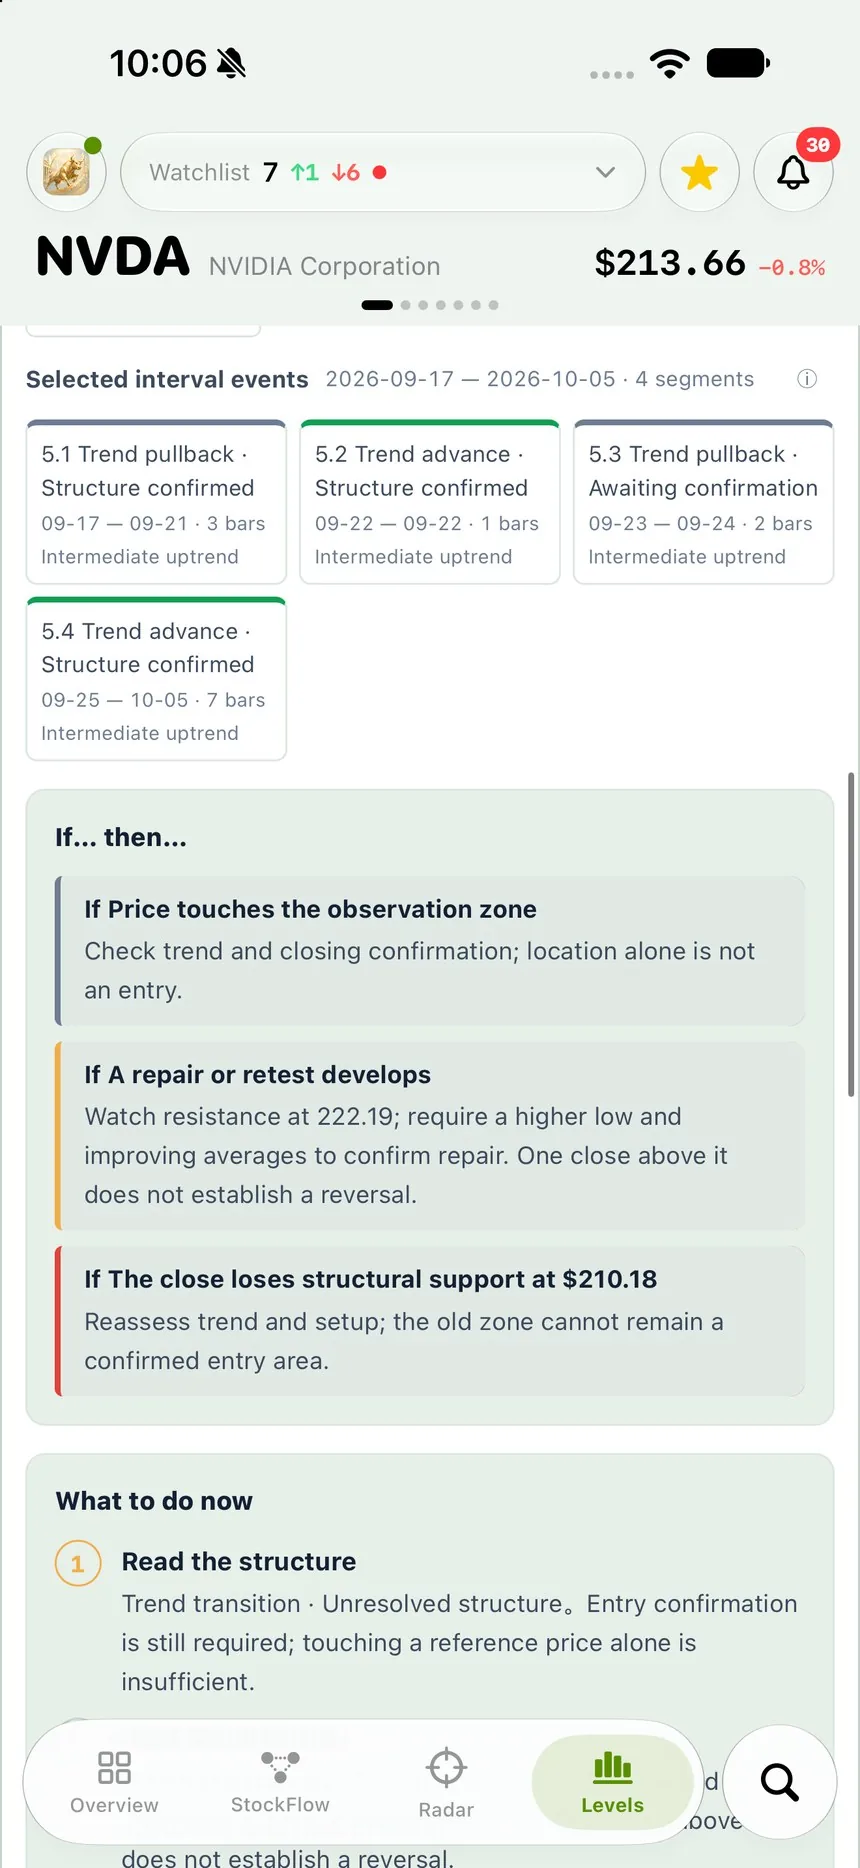
A selected stretch broken into its own events, each with its confirmation
03

Learn how it unfolded

Inside a stretch, the read changes day by day: pullback, confirmed, advance, awaiting confirmation. Hit Historical replay to step back to any day and see what the chart said then — using only the bars that existed that day.

Key levels: fair value range, targets, averages and price, each with distance in percent and ATR
04

Levels with a reason

Targets come from resistance the stock has actually met — swing highs, 20-, 60- and 120-day highs. Where there is none, they’re labeled as risk multiples. Every level shows its distance in percent and in average daily ranges.

If-then scenarios and what to do now
05

If this, then that

The structure becomes a plan: what would confirm a repair, the close that would break the case, and three steps for now — read the structure, wait for confirmation, know where it’s invalid.

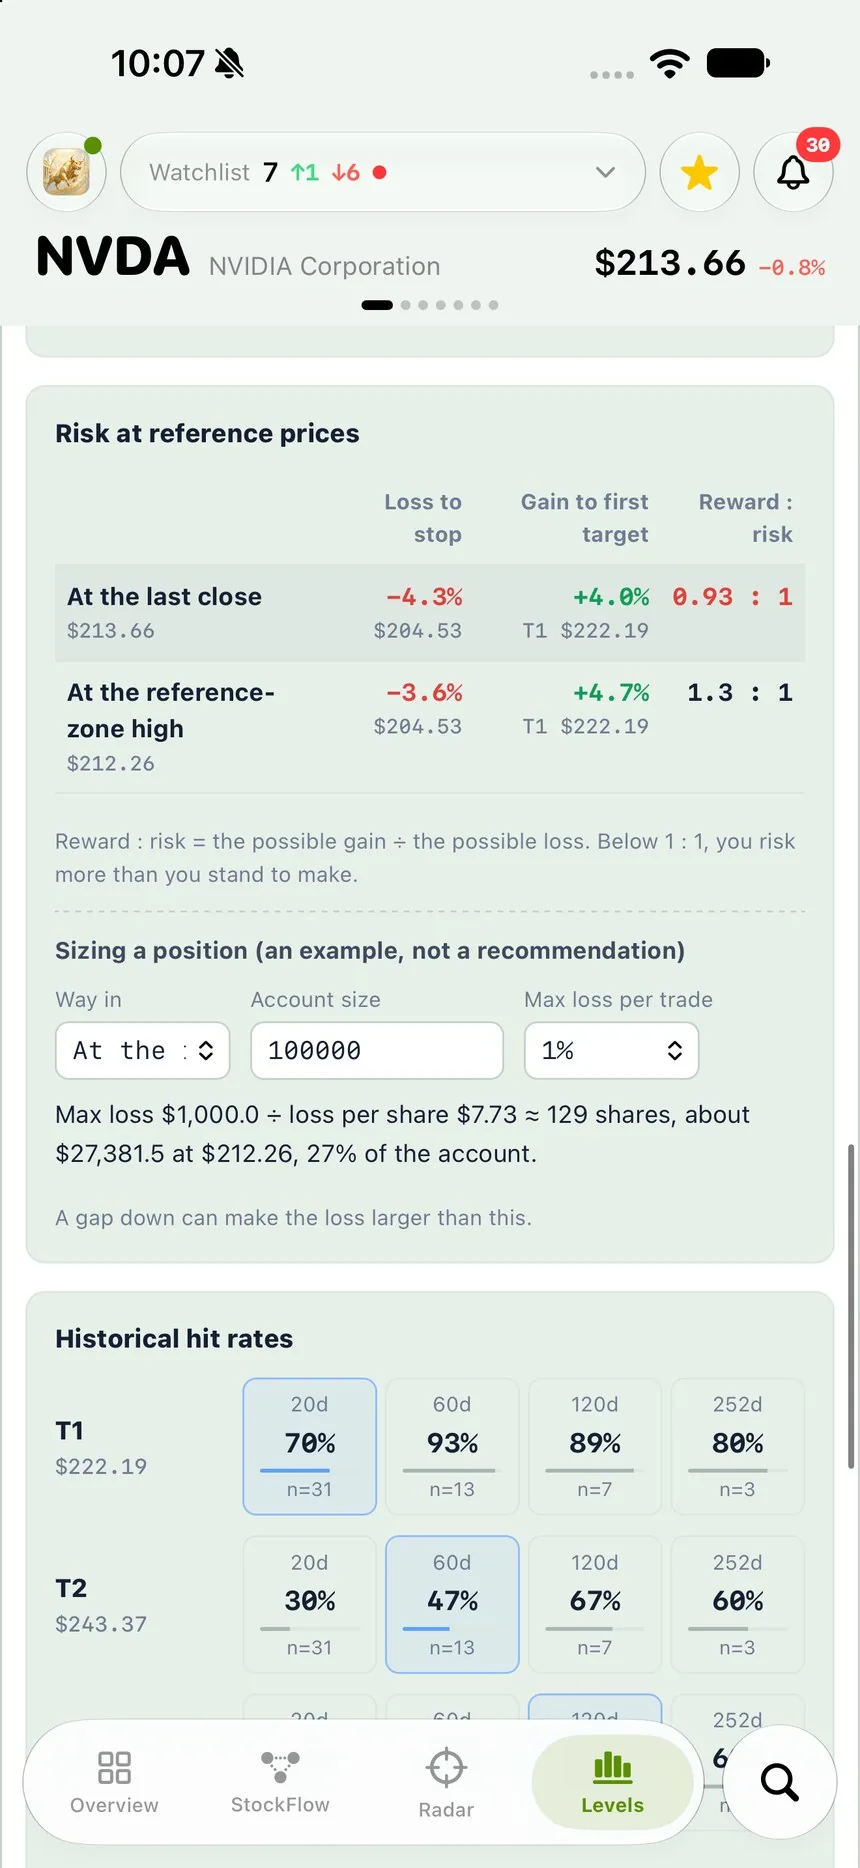
Risk at reference prices, position sizing, and historical hit rates with sample sizes
06

Size it, check the history

Reward-to-risk at each price and shares for a 1% max loss. Then the history: past days in the same trend, pattern and status, and how often each target was touched — T1 within 20 days: 70%, n=31. Not a win rate, and we say so.

Also on the web

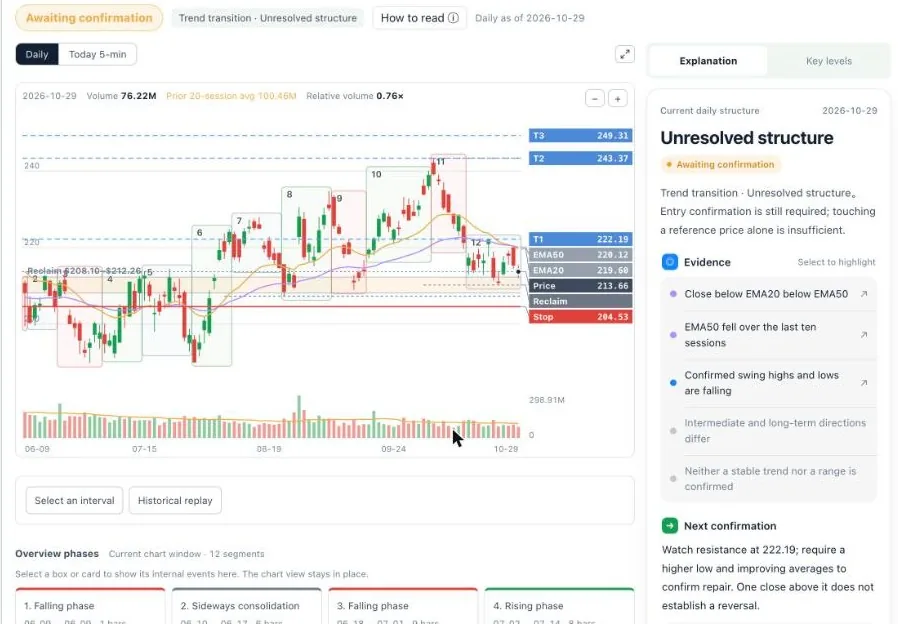
The chart and its explanation, side by side.

Chart analysis on the web: numbered phases on the chart, levels on the right, and the explanation panel with evidence

Reference levels, not investment advice. Real screenshots · NVDA, close of 2026-10-29.

Pick how you invest

Same stock.
Four ways to use it.

You trade within the day. You care about

what just hit the tape.

  1. 1
    Turn on alerts for your watchlist

    Filings and press releases land in your inbox within minutes, filtered by stock.

  2. 2
    Open Overview

    The reason for the move, then today’s 5-minute chart against yesterday’s close.

  3. 3
    Switch Levels to Today 5-min

    The reclaim zone and stop on today’s bars — and a size for a 1% max loss.

Best on Plus · Elite for levels →
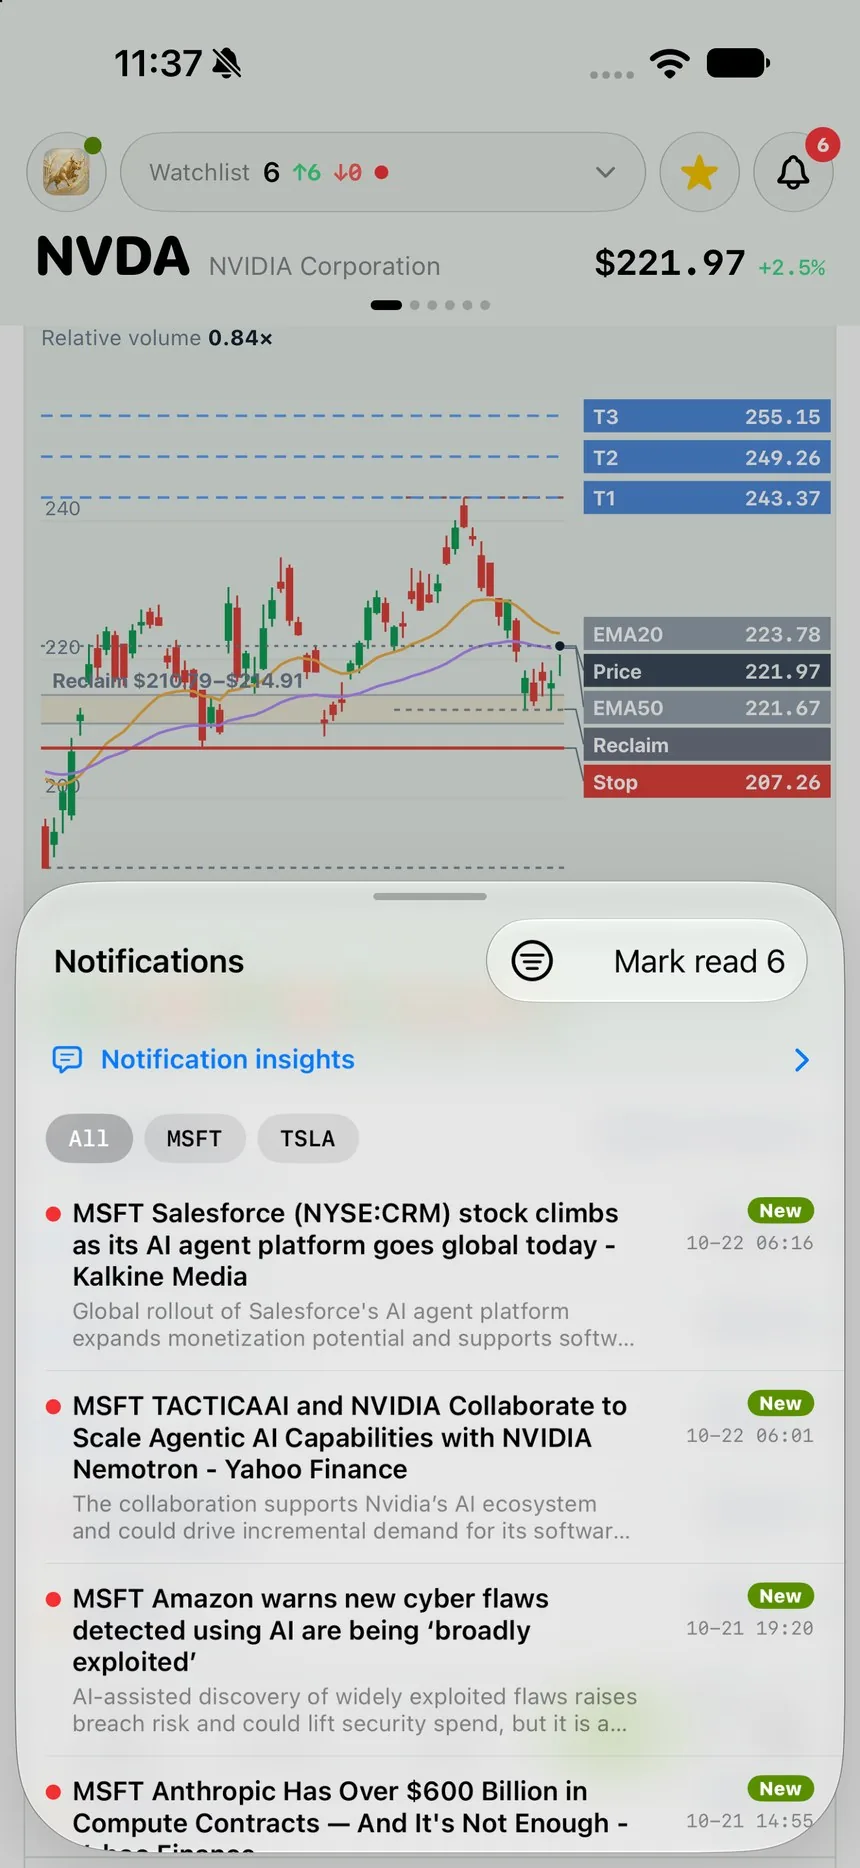
Notification center filtered by stock

Your watchlist · your inbox

Told when it
matters.

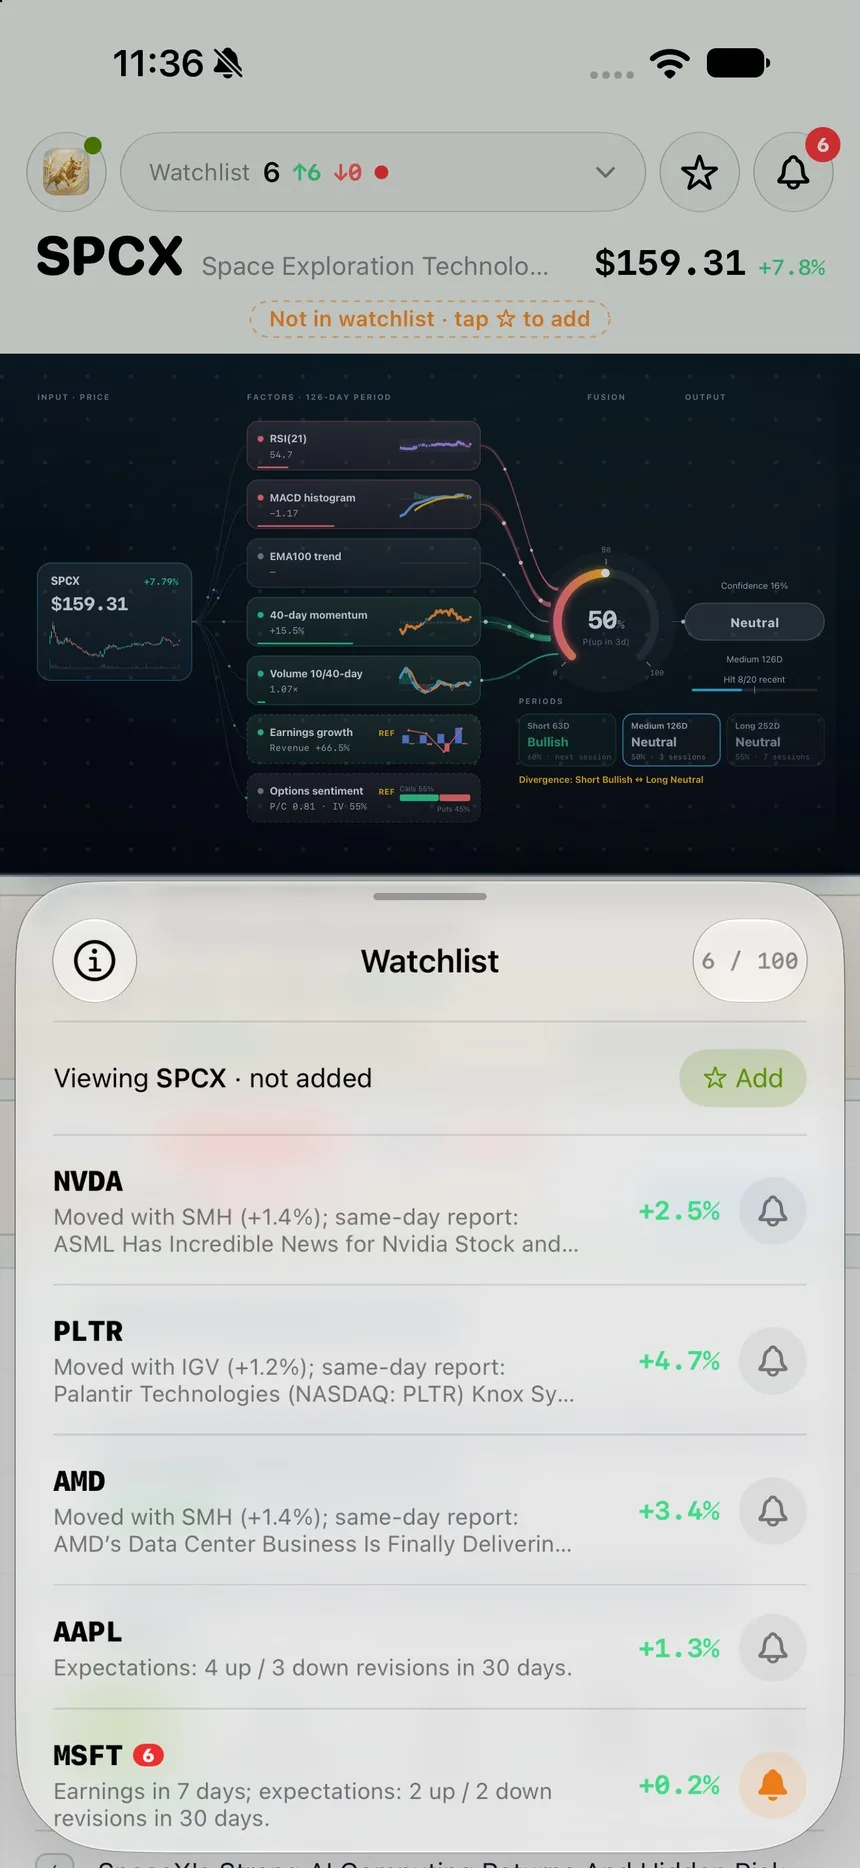
Every stock you follow carries a one-line reason. Filings, press releases and news land in one inbox, filtered by stock. Same account on the web.

Watchlist with the reason each stock moved
Notification center filtered by stock

Which plan
fits you?

One subscription for iPhone and the web. Start free; yearly billing saves up to 58%.

Free · Overview

$0

For: trying it with one stock.

1 saved stock · 5 stocks a day · StockFlow view-only · Radar’s read

Start free

Plus · StockFlow

$20/mo

or $100/yr

For: day and swing traders.

5 stocks · full StockFlow · filings in minutes

Choose Plus

Premium · Radar

$30/mo

or $200/yr

For: long-term and value investors.

20 stocks · full Radar dossier, ranks & revisions

Choose Premium

Elite · Chart analysis

$60/mo

or $300/yr — $25 a month

For: anyone who reads the chart before acting.

100 stocks · phases · any-stretch reads · levels · scenarios · sizing · hit rates

Choose Elite

Compare every plan → · Final price shown at checkout · Card and Alipay

Know why.
Then decide.

Free plan · no card needed · reference levels, not investment advice